| _________ |
 |
__________ | ||||||||||||||||||||||||||||||||||||||||||||||||
|
FDIB Scientific E-Zine @ 2-2001 |
||||||||||||||||||||||||||||||||||||||||||||||||||
|
Divergence Analysis of Economic Development in West and East Regions of Indonesia (Cumulative Causation Approach) Amna Suresti*, Syafrizal+, Syofyardi+ +Study
Program of Development Planning, Graduate Program of Andalas University,
Padang, Indonesia
Abstract
Keywords
Introduction
Developed regions like capital or
big cities commonly have a much higher productivity growth than underdeveloped
regions, so interregional disparities could occur. The problem is, whether
the development process in KBI and KTI is convergent or divergent toward
the equilibrium growth and if there is any difference, how to solve it.
This study aim is to analyze of economics growth model of KBI and KTI by
the cumulative causation model in order to propose a solution of the development
disparities.
Growth Model
where r is productivity growth
of KBI, KTI and Indonesia, y is output growth based on PDRB of KBI
and KTI, and PDB of Indonesia, w is wage growth of KBI, KTI and
Indonesia, and b, d, f are coefficients and a, c e are constants
obtained from a regression. To determine whether the growth model tends
to a convergent or divergent condition, the constants called Verdoorn coefficients
are calculated as followed:
If g>1 and h<0,
it is identified that the economic growth will be far from the equilibrium
growth (divergent) and if g<1 and h>0, it will reach the
equilibrium growth (convergent). The regression analysis is conducted using
an SPSS program with time series data of KBI, KTI and Indonesia for the
period of 1983-1996. The equilibrium growth (ye) is determined
using:
The factor influencing on the economical
growth is productivity. This relationship can be written as
where a and b are coefficients obtained from a regression analysis. This study uses the PDRB, PDB, population and average monthly wage/salary. The data are obtained from SUSENAS (National Economic Census), SAKERNAS (National Labor Survey) and Statistics Yearbook of Indonesia published by BPS (Statistics Center). The definitions used in the research are:
The cumulative causation model doesnt consider that a convergence occurs in interregional prosperity difference of a country, even though the country is already developed. It considers that the convergence in development process is caused by the government involvement. As described by Dixon and Thirwall (1974), every country will usually experience the Verdoorn effect. This effect causes that developed country grows fast due to a positive relationship between productivity and output, while underdeveloped country will slowly grow due to its low output. This will cause a wider disparity. Regression results of Equation 1,
2 and 3 could determine weather the development process in both regions
had a tendency to a convergence or divergence. The model was analyzed with
a simultaneous regression and the empirical results with ttest
and correlation coefficient (R2) are shown as followed:
A. With Oil and Gas (Migas)
KTI
Indonesia
B. Without Oil and Gas (Migas)
KTI
Indonesia
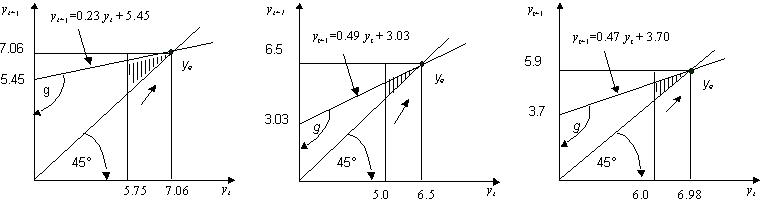
Table 1: Values of g, h and ye for KBI, KTI and whole Indonesia
The interregional growth difference is smaller than equilibrium growth, where the initial growth (yo) of 5.75% in KBI, 5.00% in KTI and 6% in whole Indonesia (without Migas), while that with Migas is also smaller than the equilibrium growth with the initial growth of 5.9% in KBI, 3.6% in KTI and 5.6% in whole Indonesia. This suggests that both regions have increasing economic growths. The situation shows that the economic development in KBI or KTI is generally getting better caused by the regional development policy referring to underdeveloped region like developments of structure and infrastructure, distribution of investment allocation, and other policies to increase labor opportunities. Although KBI, KTI and Indonesia have the same regional economic growth model, which is convergent toward the equilibrium growth, but the convergence degrees of the regions are different. If g value is low, the growth model tends to be more convergent. The g value of KBI is the lowest compared to that of KTI and Indonesia, while that of KTI is the highest at 0.603. This suggests that although the growth of KTI is convergent, but its regional economic growth difference is relatively larger than of KBI and Indonesia. This illustrates that the development in KTI is not well-distributed due to many underdeveloped provinces. Besides, the equilibrium growth degree of KTI is lower than that of KBI. Figure 1 shows the equation slopes
of yt+1 of KBI, KTI and Indonesia. The slope
for KBI is very small that means a well development distribution, while
of KTI is high so its development distribution is very low. For whole Indonesia,
the slope is almost the same to of KTI that suggests a lowly distributed
development.
Figure 1: Regional economic growth model in (a) KBI, (b) KTI , (c) Indonesia, (Non-Migas) As described above, the output growth is influenced by productivity growth (y=a +b× r). Tabel 2 shows the empirical result for KBI and KTI with and without Migas. This table explains that the productivity growth influence on output growth is high in KBI and KTI. But KTI has a lower output growth than KBI, so the policy to decrease the interregional disparity is increasing labor productivity and output growths in KTI. Therefore, the government has an important role to increase capability of regional goverments in KTI in order to be more active in the economical development. Table 2: Empirical result of the equation of y=a +b × r for KBI, KTI and Indonesia
Conclusion and Recommendation Based on the empirical result of the cumulative causation model, the regional economic growth in whole Indonesia is convergent toward the equilibrium growth as well as in KBI and KTI. The factors influencing on the economic growth of these regions should be the labor productivity growth. But the economic growth of KBI is more convergent than of KTI and Indonesia. This suggests that the economic development of provinces in KBI is more distributed than in KTI. The proposed recommendation is to
give the highest priority of the economic development to underdeveloped
regions with increasing the labor productivity growth by increasing skill
and education of the labor. The other ways are creating economic growth
regions in KTI based on their potential resources and to make investors
interested to go to the East.
References
Syafrizal. 1997. Profil dan Permasalahan Wilayah Indonesia Bagian Barat. Prisma, No. 3 This article was
published in:
Suresti, A., Syafrizal, Syofyardi. (2001). Divergence Analysis of Economic Development in West and East Regions of Indonesia (Cumulative Causation Approach), FDIB Scientific E-Zine, Berlin, February 2001. https://fdib.tripod.com/e-zine/ez-amna.html . |
||||||||||||||||||||||||||||||||||||||||||||||||||
| KEMBALI- | --- | -- |